Great Trades
Great stock trades based on fundamentals and technical analysis.Monday, June 21, 2010
Gold, Silver Breakout, Retest Success


Sunday, June 06, 2010
Test Failure! Focus on Gold, Silver
On the other hand, another break of the 1090 support area probably means more selling is ahead before the market stabilizes.
On Thursday, the SPX rallied right up to 1105, where the 200-day moving average is, but couldn't get through that key level. On Friday, in reaction to the poor Non-Farm Payrolls report and more bad news from Europe, the SPX dropped well below the 1090 support area, selling down all the way to 1065 for its lowest close since February:

The SPX couldn't even make it up to its 20-day EMA before Friday's carnage.
You can see from the chart that using above/below the 20-day EMA as a guide to favoring the long/short side has worked well.
The QQQQ chart only could muster one day above its 20-day EMA, as Friday's selloff moved it back well below that moving average:

This action, as well as the SPX drop below its 12-month EMA, favors the short side for the stock market as long as these EMA's remain above current prices:

The SPX will likely bounce around with high volatility, but if it can't close this month above the 1082 area, that would likely indicate this weak period for stocks could last a while.


This stock market weakness has rewarded those who went long gold and short the stock market based on the monthly GLD/QQQQ buy signal we posted on May 2

The VIX, bonds, and the the Put/Call ratio all look like they could drop quite a bit in a more stabilized stock market environment, as long as the news flow gets less negative.
With the news flow getting even more negative on Friday, rather than less negative, the VIX and bonds moved right back above their uptrend lines that were broken earlier in the week:

While we thought the stock market might enter a more stable period with a successful close over SPX 1105, Friday's poor news and horrible reaction killed that possibility for the near future. The 1105 test for the market was an abject failure.
We continue to believe that investors and traders who favor the long side will be better off focusing on gold and silver during this period of stock market instability. With the global debt problems and currency devaluations, the fundamentals also favor these precious metals that have served as real money throughout history.
Wednesday, June 02, 2010
Summer Rally?
The next test will be the 200-day moving average at around 1105. There's also an inverse head & shoulders pattern on the hourly SPX chart, which will get a confirmed breakout over 1105.
If the SPX can get through 1105, the market could be in for a nice rally. The VIX, bonds, and the the Put/Call ratio all look like they could drop quite a bit in a more stabilized stock market environment, as long as the news flow gets less negative.
Below is the QQQQ chart we posted last month in our warning to switch from stocks to gold. Now, with some follow-through rallying tomorrow, we could be exiting an unstable stock market period and entering a more stable period again.

Notice that MACD got a bullish crossover in February at the beginning of the stable February-April period. Now, an up day tomorrow would confirm another bullish MACD crossover, and would also move QQQQ over its 20-day EMA. You can see from the chart that using above/below the 20-day EMA as a guide to favoring the long/short side has worked well.
Here's a similar chart for the $VIX, which normally moves in the opposite direction of the stock market:

The $VIX looks like it's broken its uptrend and had a bearish crossover on MACD. If the VIX continues to drop, the market should be much more stable.
Here's one for TLT, the ETF for 20-year bonds:

Bonds, which have rallied during this unstable period because of their "safe haven" status, also could be breaking their uptrend and also have had a bearish MACD crossover.
And here's one for the Put/Call Ratio:

The Put/Call Ratio is also coming down from an extreme level. Selling panics feature increased put buying, whereas market stability features more balanced put and call buying.
There are lots of people calling for a market crash coming any day now, and they may be right, but these indicators are pointing to market stability instead if we get some follow-through strength in coming days, especially tomorrow, and especially over 1105 SPX. An up day tomorrow would also be the first time we'd see 2 consecutive up days since April, which would be another sign of renewed stability. On the other hand, another break of the 1090 support area probably means more selling is ahead before the market stabilizes.
If we do see a summer rally, that would keep the SPX above its 12-month EMA (if it lasts until at east the end of June) and keep this cyclical bull market going for at least a little while. This chart shows that the 12-month EMA has done a pretty good job of identifying the trend over the last 10 years:

It's still a dangerous market, but if we do see some follow-through strength tomorrow, it should become a lot less dangerous for a while. We believe any summer rally would be a selling/shorting opportunity, but if it happens, you won't want to short too soon.
Sunday, May 09, 2010
Portfolio Re-allocation Update: Sell Stocks, Buy Gold and Silver
After the strong rally in stocks over the past year+, this looks like a particularly good time to reallocate portfolio assets from non-mining stocks into gold and silver. While stocks look like they could be in for more selling, gold is breaking out to new highs on the year, and is very close to breaking out to new all-time highs.
Right now, this portfolio re-allocation strategy indicates a shift to long gold and short the Nasdaq 100 should be made.
This breakdown from the rising wedge, along with the weekly bearish engulfing candlestick, VIX breakout over 20, and the excessive bullishness of newsletter writers, increases the likelihood that the market is in for more selling. A number of other indicators point to more selling to come, though there's a possibility of a short-term bounce first after Friday's sharp sell-off. Any market bounce or gold/silver pullback should be used to sell non-mining stocks.
We got the short-term bounce on Monday, which was the perfect opportunity to sell out and reverse to short on the Nasdaq 100. Then, there was a small pullback in gold on Tuesday into Wednesday, which was a great opportunity to add more gold, and a larger pullback in silver and mining stocks into Wednesday, which was a great opportunity to add more of both (we pointed that out in our Wednesday morning blog update.
After Monday, the Nasdaq, along with the rest of the stock market, was hit very hard, with its worst week since the March 2009 lows, highlighted by the intraday collapse during Thursday's historic selloff:

Meanwhile, gold has broken out to a new all-time closing high on the weekly chart:

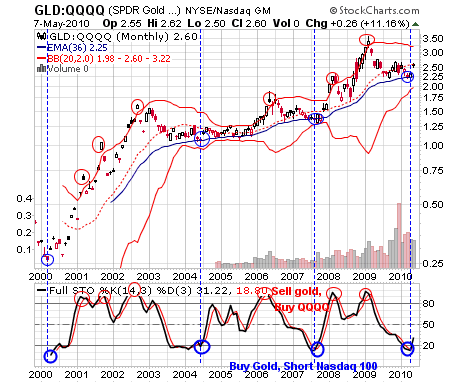
The result has been a clear and powerful breakout on the GLD/QQQQ chart:

The monthly chart of this ratio now shows a clear buy signal:
Back in March 2009, near the beginning of this rally, we highlighted the importance of 9-to-1 up days in identifying bear market bottoms:
This award-winning paper, Identifying Bear Market Bottoms and New Bull Markets, discusses the fact that major market bottoms are identified by a series of 90% downside days followed by 90% upside days. This is exactly what we've had in recent weeks, and it looks like today we had a 3rd 90% upside day of this rally.
Now, coming off the recent peak, there has been a cluster of 9-to-1 down days:

The last time we saw such a cluster of 9-to-1 down days coinciding with the breakout of the VIX from a base in the 20 area was in September 2008, which was the start of the precipitous decline that ended in the March 2009 bottom. That doesn't mean that the same type of decline will happen again here, but it's certainly a possibility for which investors should be prepared.
There are some other indicators pointing to the likelihood of more selling to come.
The weekly chart of the S&P 500 now shows a bearish cross on PPO:

On the daily S&P 500 chart, the 13 and 34-day exponential moving averages have crossed back down (blue line crossing below red line):

These bearish cross signals are negatives for the stock market, but, as happened at the February bottom this year and July bottom last year (we pointed out the bullish 13/34 cross in our July 20 update ), they can be overcome with a strong rally back.
After this week's strong selloff, the market is at extremely oversold levels on a short-term basis.
Over the last 10 years, the NYMO (NYSE McLellan Oscillator) has dipped below -100 only 7 times, and only once below the current level (October 2008):

Each time the NYMO has reached these oversold readings, the S&P 500 has bounced for at least a day or two, starting immediately or within a couple of days. However, with the exception of November 2009, every one of these bounces has been met with selling to lower levels. Also, every one of these readings came with the NYSI at a lower level (NYMO is the rate of change of the NYSI), so there's now a lot more room for negative NYMO readings to come.
After the break of 20 resistance the previous week coincided with the beginning of the selling, the VIX has now more than doubled from that point, closing well above its upper Bollinger Band on Friday:

Given the current state of our technical indicators, we don't believe the selling is over for the stock market yet, and there could be much more to come. However, given the extremely oversold conditions in the short term, we could see a market bounce any time now.
With gold breaking out to new highs (weekly chart in U.S. dollars, all charts in other currencies) and the Gold/QQQQ ratio on a long-term buy signal, we continue to believe investors should use market bounces as an opportunity to shift portfolio allocation away from non-mining stocks toward gold and silver as well as mining stocks (those with large amounts of gold or silver), with aggressive investors also shorting the U.S. Stock market. Most people are only now seeing that fiat currencies are in a race to devalue in order to service their debt, resulting in the inevitable increase in the relative value of the hard currencies, gold and silver, which have over many centuries been the real store of value.
Wednesday, May 05, 2010
Update: Stocks Sell Off, Gold/Nasdaq 100 Ratio Buy Signal
This breakdown from the rising wedge, along with the weekly bearish engulfing candlestick, VIX breakout over 20, and the excessive bullishness of newsletter writers, increases the likelihood that the market is in for more selling. A number of other indicators point to more selling to come, though there's a possibility of a short-term bounce first after Friday's sharp sell-off. Any market bounce should be used to sell non-mining stocks.
Monday's short-term market bounce proved to be a great opportunity to sell stocks, and this pullback in silver and mining stocks, which were caught up in today's 225-point market selloff (likely hedge fund liquidations in thin markets), should prove to be a great buy opportunity for anyone doing this portfolio re-allocation.
As for the monthly Gold/Nasdaq 100 ratio chart, the stochastics lines have crossed back up:
Right now, this portfolio re-allocation strategy indicates a shift to long gold and short the Nasdaq 100 should be made. This ratio is just coming off the 36-month EMA, and the stochastics lines are oversold below 20, and look like they should cross back up soon.
Sunday's chart:

As you can see above (bottom pane), the black stochastics line was 11.84 while the red stochastics line was still above it at 13.50.
After today's action, the black stochastics line (16.62) has crossed back above the red stochastics line (13.93) to trigger a stochastics buy signal:

Keep in mind that this is a monthly chart, and May has just begun. It's the end of the month that counts on a monthly chart, so the stochastics lines will need to remain crossed back up at the end of May for this buy signal to be valid. Also, May is just one month -- this longer term chart could take several months to generate a stochastics buy signal if this cross doesn't hold.
It's a good start so far for this portfolio re-allocation strategy shift, but it won't be proven a success for a few more months.
Sunday, May 02, 2010
Portfolio Re-allocation: Sell Stocks, Buy Gold and Silver
If recent history repeats itself, we should soon see a short-term pullback, which should be followed by new highs in the S&P 500.
The previous 10 times this EMA has peaked over 600 in the past year, the market has had a short-term pullback. Every one of those pullbacks has proven to be a buying opportunity, followed by new highs in the S&P 500.

Unlike the previous 10 times the TICK 10-day EMA peaked over 600, this time the market pullbacks were very brief, primarily limited to intra-day sell-offs. After this EMA dipped back under 200, it bounced back up toward 600 as the S&P 500 (SPX) rallied to a new high, peaking at 1219.80 this past Monday.
On the next day, Tuesday, something happened that we warned about in the last update:

Tuesday's break of 20 resistance in the VIX coincided with the largest market drop in months, as the SPX dropped from near 1220 on Monday to near 1180 on Tuesday. Since that VIX spike sent the VIX well above its upper Bollinger Band, and also sent other short-term indicators into very oversold territory (e.g., TRIN), the SPX bounced back to as high as 1209.36 on Wednesday and Thursday, dropping the VIX back under 19. On Friday, the VIX broke through 20 resistance again, as the market plunged again, with the SPX closing at 1186.69, closing out the week with a bearish engulfing candlestick sell signal on the weekly chart.
Now, the VIX is again above its upper Bollinger Band, but only slightly, at 22.05 vs. 21.59. The upper Bollinger Band is rising sharply, so the VIX can likely continue higher and still stay near its upper Bollinger Band. The TICK 10-day EMA is back under 200, but it can go significantly negative before rebounding, as it did in February, October, and a number of times in the previous 12 months.
The key level to watch for now is this past week's low, which was 1181.62 on the SPX. The Russell 2000 has already broken below its Tuesday low by over 3 points, and that small-cap index has been leading the market higher in recent months. If the other market indices follow, we should see a more significant market pullback. As this article points out, the three to one ratio of bullish to bearish newsletter writers is a red flag warning that could mean the market is in for a sizable correction.
On the Nasdaq 100 (NDX or QQQQ), the rising wedge uptrend since the February low was finally broken on Friday:

This breakdown from the rising wedge, along with the weekly bearish engulfing candlestick, VIX breakout over 20, and the excessive bullishness of newsletter writers, increases the likelihood that the market is in for more selling. A number of other indicators point to more selling to come, though there's a possibility of a short-term bounce first after Friday's sharp sell-off. Any market bounce should be used to sell non-mining stocks.
While the stock market looks like it's in for some more selling, the gold and silver markets look very strong. We've advocated accumulating gold, silver, and quality mining stocks on pullbacks, and that strategy has worked quite well:
Considering the longer-term trend higher in gold in its powerful bull market, this pullback should prove to be a great buying opportunity for longer term, for gold and silver as well as quality mining stocks.

After the strong rally in stocks over the past year+, this looks like a particularly good time to reallocate portfolio assets from non-mining stocks into gold and silver. While stocks look like they could be in for more selling, gold is breaking out to new highs on the year, and is very close to breaking out to new all-time highs.
Holding a portfolio allocation of long gold and short the Nasdaq 100 from early 2000 for 9 years would have made over 10 times your money, with similar results for silver:

Shifting portfolio allocation from gold and silver to the Nasdaq 100 and back based on stochastics signals (bottom pane) would have yielded even much better results, particularly when combined with the 36-month EMA and Bollinger Bands. Moving from gold to the Nasdaq 100 when this ratio was well above its upper Bollinger Band and the faster black stochastics line crossed below the slower red stochastics line above the 80 level, and then moving from the Nasdaq 100 back to gold when this ratio came back to meet the 36-month EMA while the stochastics lines were below the 20 level would have yielded tremendous returns with very little drawdown, and particularly strong outperformance during market corrections.
Right now, this portfolio re-allocation strategy indicates a shift to long gold and short the Nasdaq 100 should be made. This ratio is just coming off the 36-month EMA, and the stochastics lines are oversold below 20, and look like they should cross back up soon. Quality gold and silver mining stocks are also recovering from their financial crisis lows, and those that are well-financed with large deposits are poised to move up much faster than gold and silver because of their leverage. Mining juniors that have survived the financial crisis while maintaining large deposits and improving or maintaining healthy cash positions may perform the best of all because of their extreme leverage.
Silver has been more volatile than gold in recent years, but remains severely undervalued relative to gold on a historical basis. Currently, the gold/silver ratio is around 63.5, but the historical average over the centuries has been around 16. That means that if silver returns to its historical ratio with gold, it should quadruple relative to gold, even if gold is headed to much higher levels. This article discusses some reasons silver should move much higher relative to gold. For long-term investors, silver and silver mining stocks, particularly quality juniors with large deposits, could have exponential returns if the precious metals bull market continues.
As for fundamentals, the sovereign debt crisis around the world is starting to evidence itself with the crisis in Greece and the downgrades of Spain and Portuguese debt. As sovereign debt issues decrease the value of paper currencies around the world, the value of the hard currencies, gold and silver (the word for money in many languages is the same as the word for silver), will increase significantly.
This article describes the fundamental issues pointing to much higher gold and silver prices
This NY Post article from April 11 described the gold and silver price manipulation to keep prices down.
Given the current technicals as well as the fundamentals, it looks like a strategic shift of portfolio allocation from stocks to gold and silver will likely pay off handsomely, especially if anything comes of any DOJ investigation into silver market manipulation. Aggressive traders can go short the Nasdaq 100 while going long gold and silver to fully participate in this ratio strategy. Even if the stock market continues higher unabated, the likely faster increase in gold and silver should reward investors who make this shift. If stocks should finally experience a significant pullback while gold and silver break out, this shift could be a life changer for some.
Monday, March 08, 2010
Pullback time?
If the VIX continues lower to establish a new range and the S&P 500 can break out above 1120 resistance, that would be bullish for the stock market in the short term, especially during this seasonally strong time of the year. However, the last time the VIX broke below 20 support, in August 2008, the short-term rally was followed by the precipitous market decline into the fall. Also, January has featured sharp declines in each of the last 2 years.
Given the recent market action, it looks most likely that the S&P 500 will finally be able to break through 1120 resistance (perhaps after a very short-term pullback) and spurt higher in a short-term rally as the VIX establishes a new range. Depending on the market action, such a rally could prove to be a selling opportunity, judging from the last couple of years.
As expected, the rally in January was a selling opportunity, followed by a sharp decline of over 100 S&P 500 points. The sharp decline into February proved to be a buying opportunity, featuring a VIX spike over 29, outside its upper Bollinger Band.

Since the February low, the S&P 500 has rallied back strongly, pushing the VIX back down to the 17's, the same area as the January low, which corresponded with the high in the S&P 500 in the 1150's. Again, the market spurted higher once the VIX broke below 20 support.
Now, for the first time since September, the TICK 10-day EMA is back above 600 again, and a number of other indicators are at short-term overbought extremes. The previous 10 times this EMA has peaked over 600 in the past year, the market has had a short-term pullback. Every one of those pullbacks has proven to be a buying opportunity, followed by new highs in the S&P 500.

If recent history repeats itself, we should soon see a short-term pullback, which should be followed by new highs in the S&P 500. However, a break of 20 resistance in the VIX could again spur a sharper pullback in the market. If the pattern of higher highs in the S&P 500 is broken this time, the market could be in for more than just a short-term pullback.
Considering the longer-term trend higher in gold in its powerful bull market, this pullback should prove to be a great buying opportunity for longer term, for gold and silver as well as quality mining stocks.
Indeed, the precious metals pullback in December proved to be a great buying opportunity, as did the February pullback. We continue to view all pullbacks in precious metals and quality mining stocks as buying opportunities in a powerful bull market.
As we've mentioned before, our blog updates will continue to be less frequent than previously, as we focus on expanding, updating, and testing our automated futures trading system across different markets, different timeframes, and various conditions.
Tuesday, December 22, 2009
VIX Break Below 20 Support, Gold Pullback
At the time of our last post, the S&P 500 had rallied over 60 points in less than 6 trading days. In the ensuing 6 weeks, the S&P 500 has traded in a narrow range from 1085-1120.
Until today, the VIX has remained in the lower 20's during that time:

Today, the VIX finally broke below 20 support, for the first time in over a year. The S&P 500 closed at the upper end of its recent trading range, at 1118.02.
If the VIX continues lower to establish a new range and the S&P 500 can break out above 1120 resistance, that would be bullish for the stock market in the short term, especially during this seasonally strong time of the year. However, the last time the VIX broke below 20 support, in August 2008, the short-term rally was followed by the precipitous market decline into the fall. Also, January has featured sharp declines in each of the last 2 years.
If the S&P 500 fails to break through 1120 resistance during this holiday season, that would be a negative for the market, especially if the VIX break below 20 turns out to be a head-fake, and the lower end of the recent range (at SPX 1085) is broken instead.
Given the recent market action, it looks most likely that the S&P 500 will finally be able to break through 1120 resistance (perhaps after a very short-term pullback) and spurt higher in a short-term rally as the VIX establishes a new range. Depending on the market action, such a rally could prove to be a selling opportunity, judging from the last couple of years.
Gold has had a very strong rally recently, so a short-term pullback can happen at any time, but the longer-term trend continues to be higher.
After a very strong rally to well over $1200, gold has pulled back over $150 in less than 3 weeks in a short-term pullback, as the U.S. Dollar has rallied back strongly following a strong decline since March. Considering the longer-term trend higher in gold in its powerful bull market, this pullback should prove to be a great buying opportunity for longer term, for gold and silver as well as quality mining stocks.
Fund update: Our plans to start a fund have been placed on hold, pending the proposed onerous trader transaction tax. Such a tax would put many funds out of business. Until the dust settles on this silly legislation, we'll continue live testing across markets under different conditions. Testing continues to go very well.
Monday, November 09, 2009
Rally as Expected, Another Gold All-Time High
As expected, the market rallied into the FOMC announcement, and then continued higher the next 3 days. In the 4 trading days since our last post, the Dow has rallied over 450 points, making a new 52-week high. The S&P 500 hasn't yet made a new 52-week high, but is within 8 points of one and broke the September high.
This updated chart of the VIX and SPX shows the sharp short-term rally we were expecting after the VIX spike above its Bollinger Band:

The VIX has dropped sharply from the lower 30's to the lower 20's, which has been a strong support area recently, so this sharp short-term rally may be nearing its end.
The updated chart of the TICK 10-day EMA shows that it's once again approaching the 600 level:

As we said after the last peak over 600, "Since the first peak over 600 on the TICK 10-day EMA, back in March, there have been 9 straight higher highs marked by subsequent peaks over 600 on this EMA." If we get a 10th higher high with another peak over 600, we'll then look for another short-term pullback, and see if that pullback will be yet another buying opportunity, or a trend change with a lower low.
Friday's small NYMO change had us expecting a big move early this week, and today was a very big move, both in terms of points and breadth, marking a strong 90% upside day (we first discussed 90% upside and downside days here). This chart shows that today was actually an 18-to-1 day in terms of NYSE Volume:

While the breadth of today's rally is impressive, there were also impressive 9-to-1 downside days in late October on higher volume. Those selloffs proved to be buying opportunities, so it's possible that this rally could prove to be a selling opportunity. However, if there are more 9-to-1 upside days in the near future, the market could be headed significantly higher.
Watch for a bearish cross on the weekly PPO and a break of the weekly uptrend to signal a more significant market correction. If the TICK 10-day EMA can't reach the 600 level on the next bounce, or the market fails to sustain a rally from oversold NYMO levels, the medium-term trend could be changing.
This updated weekly S&P 500 chart shows we haven't yet had a bearish cross on the weekly PPO, and though the uptrend line from the March low was broken in late October, the early October low held, keeping the weekly uptrend intact:

We should see soon whether the TICK 10-day EMA reaches the 600 level and whether this rally from oversold NYMO levels lasts. While it won't take much of a drop in coming weeks to trigger a bearish cross on weekly PPO, we won't be comfortable looking for a significant market correction until we get such a cross, along with some other indicator confirmations. A failure to make a new high in the S&P 500 would be the first indication of a more significant market correction, with a break of the October low a confirmation.
This expected short-term rally has brought some mixed signals. The new Dow high and strong breadth are positives, but the lower volume and negative divergences are negatives. In the very short term, the high closing TICK and very low closing TRIN indicate likely weakness early tomorrow. The market action in coming days should help point to the next significant move direction.
As expected, gold and silver have continued higher, with gold closing over $1100 an ounce for the first time ever today. Gold has had a very strong rally recently, so a short-term pullback can happen at any time, but the longer-term trend continues to be higher.
As we've been saying, "The precious metals could be in for an extended rally period on this breakout. If so, the miners should be in for a strong bull move." The XAU and HUI mining indices both closed at new 52-week highs today, and junior miners have continued their recovery.
Tuesday, November 03, 2009
Another Gold Breakout, Short-term Market Rally?

It took less than a week for gold to rebound and break out to another new high, with a strong $25+ rally today despite the U.S. Dollar moving higher on the day. Silver also rallied strongly, up over 4% today alone. The precious metals had been moving inversely to the dollar, so today's strong move higher in the face of a stronger dollar could bode very well for continued strength even if the dollar rebounds.
As we said last month, "The precious metals could be in for an extended rally period on this breakout. If so, the miners should be in for a strong bull move."
As this chart shows, the TICK 10-day EMA is below 0 for the first time since the June/July dip (though it has room to move lower)
And move lower it did, dipping down below the oversold line late last week:

On that move lower, the NYSE McClellan Oscillator (NYMO) moved lower than at any other point during this rally:

Previous spikes down in the NYMO during this rally have been followed by short-term rallies.
Also, the VIX spiked well over its upper Bollinger Band. It was the 5th time since this rally began in March that the VIX spiked to or above its upper Bollinger Band. The previous 4 times, the S&P 500 rallied back sharply short term after the VIX spike:

Given the recent history of the market rallying sharply short term after a VIX spike above its upper Bollinger Band and a spike down in the NYMO, combined with the upward market bias heading into the FOMC announcement, there's a good chance the market will move up into that announcement tomorrow afternoon. If recent history is a good indication, the market also should continue higher over the next few days.
Despite the recent market pullback, the S&P 500 has held its October lows, meaning a rally from here would mark another higher low. However, if the market fails to make a new high on this next rally, and then makes a lower low, the medium-term trend will have changed from upward to downward. A short-term rally followed by a lower low would likely also put in place a head and shoulders topping pattern, which might finally lead to a more significant market correction.
As we said last time, "Watch for a bearish cross on the weekly PPO and a break of the weekly uptrend to signal a more significant market correction. If the TICK 10-day EMA can't reach the 600 level on the next bounce, or the market fails to sustain a rally from oversold NYMO levels, the medium-term trend could be changing."
A number of indicators and negative divergences are pointing to a possible change in the medium-term trend to the downside. However, a new high would extend the rally and keep the trend moving to the upside. Aggressive traders may want to reduce long exposure and increase short exposure on the next rally, with a stop on the short exposure at a new high. More conservative traders and investors may want to wait for confirmation of a trend change with a lower high and lower low combined with other indicator confirmations.
Tuesday, October 27, 2009
Another market dip, or trend change?

Each time the NYSE McClellan Oscillator (NYMO) has dropped to this area during this rally, the market has rallied back to make a new high. If this rally is to continue without a more significant correction, it should do the same once again:

As this weekly chart shows, the S&P 500 has been trending higher since March with a bearish divergence on PPO, just as it had been trending lower into March with a bullish divergence:

Watch for a bearish cross on the weekly PPO and a break of the weekly uptrend to signal a more significant market correction. If the TICK 10-day EMA can't reach the 600 level on the next bounce, or the market fails to sustain a rally from oversold NYMO levels, the medium-term trend could be changing.
Gold has continued its breakout action, moving as high as $1070 before backtesting the previous all-time high level in the 1030-1040 area. Gold bulls will want to see a successful backtest followed by a breakout to new highs:

We continue to test our futures trading system across different markets. We await a significant downward correction in the stock market to see how our various programs perform under those conditions.
Wednesday, October 07, 2009
Breakout to New All-Time High
That didn't take long. In less than 2 trading days, gold has proceeded to break out to a new all-time high over $1040, as the action on Friday indicated. Silver was up over 4% today.
The precious metals could be in for an extended rally period on this breakout. If so, the miners should be in for a strong bull move.
Friday, October 02, 2009
Gold Bullish Consolidation
Since we posted that a week ago, gold has dipped below 990 4 times intraday, including today, only to close above that mark each time. Today's reversal off the morning dip and close above $1000 is very bullish action, and could portend a push to take out the all-time high.
Since Monday's close, the Dow has lost over 300 points, but gold has actually moved higher by over $10, even as the U.S. dollar has moved higher.
As long as the 1000 area holds, the gold action continues to look like a bullish consolidation. Traders can go long in the 1000 area with a well-defined risk using a stop below recent support (mid-980's intraday and 990 closing basis have been the recent support areas in December futures), giving a good risk/reward trading opportunity.
Friday, September 25, 2009
Another dip to buy or is the 10th time different?
If the next pullback holds the 970 area, it would be bullish for a continued rally to higher levels. If we get a short pullback like the last 7 times it peaked over 600, the second day could again be a great buying opportunity.
Since our last post early last month, the TICK 10-day EMA dipped back down near 200 in mid-August on a short-term pullback that held the 970 level, which did prove to be "bullish for a continued rally to higher levels." There were a number of consolidation days before the 2-day dip to the 970's, and the second day again proved to be a great buying opportunity.

On August 21, the TICK 10-day EMA peaked over 600 yet again, followed by several consolidation days, a short-term pullback to the 990's along with the TICK 10-day EMA dipping back down near 200, and yet another buying opportunity after 2 days of selling.
Last week, the TICK 10-day EMA peaked over 600 for the 10th time since March (each time marked with a blue vertical line in the chart above). After several consolidation days, we've now had yet another short-term pullback, with the TICK 10-day EMA dipping down near 100 on this drop to the 1045 area.
If the pattern from the last 9 times the market had a short-term pullback after the TICK 10-day EMA peaked over 600 continues, the selling the last 2 days should prove to be yet another buying opportunity. If that pattern breaks, and the market continues lower after this short-term pullback, we may finally see a deeper correction.
Since the first peak over 600 on the TICK 10-day EMA, back in March, there have been 9 straight higher highs marked by subsequent peaks over 600 on this EMA. Will there be more to come? The market action in coming days should be telling...

In other commodities, gold has been consolidating around the 1000 level recently, threatening to take out the all-time high of 1,033 from early last year. If it holds the 1000 area and pushes through to new highs, the bull trend will continue, with a target in the 1300 area from the inverse head and shoulders pattern formed since early last year. A breakout in gold should also send silver much higher, with silver needing to more than triple to reach its all-time high. Adjusted for inflation, the all-time highs for both metals is much, much higher.
Some of our long-term mining holdings have come back to life recently with the recovery in metal prices, along with improving project developments. If/when gold and silver break out, they could move much higher quickly as the sector attracts increased investor attention and shorts scramble to cover their positions.
Monday, August 03, 2009
Rally Continues
If the next pullback holds the 950 area, or even the 927-930 area, it would be bullish for a continued rally to higher levels. Given today's Dow Transports confirmation of the Dow Theory Bull Signal, we'll see next week if indeed such a pullback proves to be a great buying opportunity.
Here's the updated TICK 10-day EMA chart, along with the S&P 500 underneath:

As expected, we got a short pullback last week, and the second pullback day was again a great buying opportunity. The pullback not only held the 950 area, but actually held the 970 area, as dip buyers were out in force. As Friday's small NYMO change indicated, we got a big move day today, closing above the 1000 level.
With this rally, the TICK 10-day EMA is back above 600 again. It has room to go higher, but once it peaks, we should see at least a short-term pullback like the last 7 times it peaked over 600 since March. Previous peaks over 600 have led to more significant down moves (e.g., late August '08 and early January '09).
If the next pullback holds the 970 area, it would be bullish for a continued rally to higher levels. If we get a short pullback like the last 7 times it peaked over 600, the second day could again be a great buying opportunity. If that pattern breaks, and the market continues lower after 2 days on the next pullback, it should signal a deeper correction.
Thursday, July 23, 2009
Trend Day with Signs of Weakening
The healthiest thing for the market would be a short consolidation/pullback over the next couple of days that holds the 927-930 "Confluence" area. The next level of resistance is the June intraday high of 956. Above there, there's not much nearby resistance, so the market can move swiftly higher, especially after a bullish consolidation.
After two days of bullish consolidation, where the intraday dips of close to 1% were bought up but the SPX continued to close under 956 resistance, and where the small NYMO change yesterday indicated a big move day was coming, the SPX "moved swiftly higher" today on a clear breakout through the 956 area to close 20 points higher over 976. From the early breakout, indicators again pointed to a trend day up:
On a trend day, you'll see few or no significant TICK readings in the opposite direction (more than 800 negative, or positive on a down day, on the $TICK chart), greater than 9-to-1 up volume vs. down volume (above the blue line on the top green $NYUPV:NYDNV chart, or the second red chart on down days), and a $TRIN reading below 1 and trending lower. On these days, the market will move higher or lower in a trend without significant moves in the opposite direction, and will usually close at or near the highs (or lows) for the day.
You could make significant market profits trading trend days only, if you go with the flow. Remember -- the trend is your friend (until it ends).
As this chart shows, for most of the day, it was a clear trend day up, using the same signals mentioned last week:

There were no significant negative TICK readings through most of the day, up volume vs. down volume reached over 9-to-1, and $TRIN stayed well below 1. The breakout through 956 resistance was very strong, with lots of short covering helping to power the rally.
However, around 2:00 pm, some of the indicators started weakening -- There were more negative TICK readings (though no big ones), up volume vs. down volume was about cut in half from the high to close at 5.16, and near the end of the day, $TRIN rose above 1, indicating that more volume was flowing to the losers. Compare this chart to last week's, where up volume vs. down volume closed at its high and $TRIN closed at its low.
After a nearly straight up rally over the last couple of weeks, including a couple of days of minimal consolidation, these signs of distribution pointed to a likely impending pullback. MicroSoft, Amazon, and American Express all disappointing on earnings have moved the futures lower after hours, indicating the pullback these signals pointed to has already started.
This updated chart of the TICK 10-day EMA shows that, with today's breakout rally, it has moved well above 700, much higher than any reading in the last couple of years. If we get a short pullback like the last 6 times it peaked over 600, the second day could again be a great buying opportunity:
If the next pullback holds the 950 area, or even the 927-930 area, it would be bullish for a continued rally to higher levels. Given today's Dow Transports confirmation of the Dow Theory Bull Signal added to the bullish signals we mentioned last time, we'll see next week if indeed such a pullback proves to be a great buying opportunity.
Archives
December 2005 January 2006 February 2006 March 2006 April 2006 May 2006 July 2006 August 2006 October 2006 November 2006 December 2006 January 2007 February 2007 March 2007 April 2007 May 2007 June 2007 August 2007 October 2007 November 2007 May 2008 September 2008 October 2008 January 2009 February 2009 March 2009 April 2009 May 2009 June 2009 July 2009 August 2009 September 2009 October 2009 November 2009 December 2009 March 2010 May 2010 June 2010
Great Trades Home Email GreatTrades
Great Investments Blog Great Investment Articles BlogDisclaimer: Great Trades may have a position in all or some of the stocks discussed in this blog, but is not paid by any company to promote their stock. Great Trades contains opinions, none of which constitute a recommendation that any particular security, transaction, or investment strategy is suitable for any specific person. Great Trades does not provide personalized investment advice.

![]()