Great Trades
Great stock trades based on fundamentals and technical analysis.Sunday, May 09, 2010
Portfolio Re-allocation Update: Sell Stocks, Buy Gold and Silver
After the strong rally in stocks over the past year+, this looks like a particularly good time to reallocate portfolio assets from non-mining stocks into gold and silver. While stocks look like they could be in for more selling, gold is breaking out to new highs on the year, and is very close to breaking out to new all-time highs.
Right now, this portfolio re-allocation strategy indicates a shift to long gold and short the Nasdaq 100 should be made.
This breakdown from the rising wedge, along with the weekly bearish engulfing candlestick, VIX breakout over 20, and the excessive bullishness of newsletter writers, increases the likelihood that the market is in for more selling. A number of other indicators point to more selling to come, though there's a possibility of a short-term bounce first after Friday's sharp sell-off. Any market bounce or gold/silver pullback should be used to sell non-mining stocks.
We got the short-term bounce on Monday, which was the perfect opportunity to sell out and reverse to short on the Nasdaq 100. Then, there was a small pullback in gold on Tuesday into Wednesday, which was a great opportunity to add more gold, and a larger pullback in silver and mining stocks into Wednesday, which was a great opportunity to add more of both (we pointed that out in our Wednesday morning blog update.
After Monday, the Nasdaq, along with the rest of the stock market, was hit very hard, with its worst week since the March 2009 lows, highlighted by the intraday collapse during Thursday's historic selloff:

Meanwhile, gold has broken out to a new all-time closing high on the weekly chart:

The result has been a clear and powerful breakout on the GLD/QQQQ chart:

The monthly chart of this ratio now shows a clear buy signal:
Back in March 2009, near the beginning of this rally, we highlighted the importance of 9-to-1 up days in identifying bear market bottoms:
This award-winning paper, Identifying Bear Market Bottoms and New Bull Markets, discusses the fact that major market bottoms are identified by a series of 90% downside days followed by 90% upside days. This is exactly what we've had in recent weeks, and it looks like today we had a 3rd 90% upside day of this rally.
Now, coming off the recent peak, there has been a cluster of 9-to-1 down days:

The last time we saw such a cluster of 9-to-1 down days coinciding with the breakout of the VIX from a base in the 20 area was in September 2008, which was the start of the precipitous decline that ended in the March 2009 bottom. That doesn't mean that the same type of decline will happen again here, but it's certainly a possibility for which investors should be prepared.
There are some other indicators pointing to the likelihood of more selling to come.
The weekly chart of the S&P 500 now shows a bearish cross on PPO:

On the daily S&P 500 chart, the 13 and 34-day exponential moving averages have crossed back down (blue line crossing below red line):

These bearish cross signals are negatives for the stock market, but, as happened at the February bottom this year and July bottom last year (we pointed out the bullish 13/34 cross in our July 20 update ), they can be overcome with a strong rally back.
After this week's strong selloff, the market is at extremely oversold levels on a short-term basis.
Over the last 10 years, the NYMO (NYSE McLellan Oscillator) has dipped below -100 only 7 times, and only once below the current level (October 2008):

Each time the NYMO has reached these oversold readings, the S&P 500 has bounced for at least a day or two, starting immediately or within a couple of days. However, with the exception of November 2009, every one of these bounces has been met with selling to lower levels. Also, every one of these readings came with the NYSI at a lower level (NYMO is the rate of change of the NYSI), so there's now a lot more room for negative NYMO readings to come.
After the break of 20 resistance the previous week coincided with the beginning of the selling, the VIX has now more than doubled from that point, closing well above its upper Bollinger Band on Friday:

Given the current state of our technical indicators, we don't believe the selling is over for the stock market yet, and there could be much more to come. However, given the extremely oversold conditions in the short term, we could see a market bounce any time now.
With gold breaking out to new highs (weekly chart in U.S. dollars, all charts in other currencies) and the Gold/QQQQ ratio on a long-term buy signal, we continue to believe investors should use market bounces as an opportunity to shift portfolio allocation away from non-mining stocks toward gold and silver as well as mining stocks (those with large amounts of gold or silver), with aggressive investors also shorting the U.S. Stock market. Most people are only now seeing that fiat currencies are in a race to devalue in order to service their debt, resulting in the inevitable increase in the relative value of the hard currencies, gold and silver, which have over many centuries been the real store of value.
Wednesday, May 05, 2010
Update: Stocks Sell Off, Gold/Nasdaq 100 Ratio Buy Signal
This breakdown from the rising wedge, along with the weekly bearish engulfing candlestick, VIX breakout over 20, and the excessive bullishness of newsletter writers, increases the likelihood that the market is in for more selling. A number of other indicators point to more selling to come, though there's a possibility of a short-term bounce first after Friday's sharp sell-off. Any market bounce should be used to sell non-mining stocks.
Monday's short-term market bounce proved to be a great opportunity to sell stocks, and this pullback in silver and mining stocks, which were caught up in today's 225-point market selloff (likely hedge fund liquidations in thin markets), should prove to be a great buy opportunity for anyone doing this portfolio re-allocation.
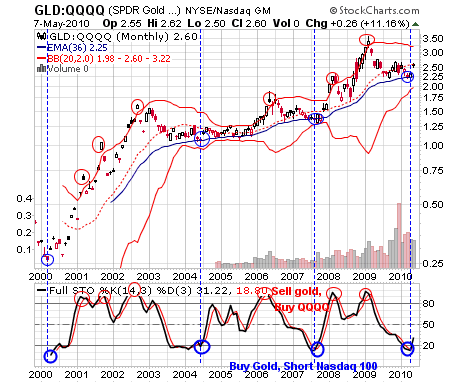
As for the monthly Gold/Nasdaq 100 ratio chart, the stochastics lines have crossed back up:
Right now, this portfolio re-allocation strategy indicates a shift to long gold and short the Nasdaq 100 should be made. This ratio is just coming off the 36-month EMA, and the stochastics lines are oversold below 20, and look like they should cross back up soon.
Sunday's chart:

As you can see above (bottom pane), the black stochastics line was 11.84 while the red stochastics line was still above it at 13.50.
After today's action, the black stochastics line (16.62) has crossed back above the red stochastics line (13.93) to trigger a stochastics buy signal:

Keep in mind that this is a monthly chart, and May has just begun. It's the end of the month that counts on a monthly chart, so the stochastics lines will need to remain crossed back up at the end of May for this buy signal to be valid. Also, May is just one month -- this longer term chart could take several months to generate a stochastics buy signal if this cross doesn't hold.
It's a good start so far for this portfolio re-allocation strategy shift, but it won't be proven a success for a few more months.
Sunday, May 02, 2010
Portfolio Re-allocation: Sell Stocks, Buy Gold and Silver
If recent history repeats itself, we should soon see a short-term pullback, which should be followed by new highs in the S&P 500.
The previous 10 times this EMA has peaked over 600 in the past year, the market has had a short-term pullback. Every one of those pullbacks has proven to be a buying opportunity, followed by new highs in the S&P 500.

Unlike the previous 10 times the TICK 10-day EMA peaked over 600, this time the market pullbacks were very brief, primarily limited to intra-day sell-offs. After this EMA dipped back under 200, it bounced back up toward 600 as the S&P 500 (SPX) rallied to a new high, peaking at 1219.80 this past Monday.
On the next day, Tuesday, something happened that we warned about in the last update:

Tuesday's break of 20 resistance in the VIX coincided with the largest market drop in months, as the SPX dropped from near 1220 on Monday to near 1180 on Tuesday. Since that VIX spike sent the VIX well above its upper Bollinger Band, and also sent other short-term indicators into very oversold territory (e.g., TRIN), the SPX bounced back to as high as 1209.36 on Wednesday and Thursday, dropping the VIX back under 19. On Friday, the VIX broke through 20 resistance again, as the market plunged again, with the SPX closing at 1186.69, closing out the week with a bearish engulfing candlestick sell signal on the weekly chart.
Now, the VIX is again above its upper Bollinger Band, but only slightly, at 22.05 vs. 21.59. The upper Bollinger Band is rising sharply, so the VIX can likely continue higher and still stay near its upper Bollinger Band. The TICK 10-day EMA is back under 200, but it can go significantly negative before rebounding, as it did in February, October, and a number of times in the previous 12 months.
The key level to watch for now is this past week's low, which was 1181.62 on the SPX. The Russell 2000 has already broken below its Tuesday low by over 3 points, and that small-cap index has been leading the market higher in recent months. If the other market indices follow, we should see a more significant market pullback. As this article points out, the three to one ratio of bullish to bearish newsletter writers is a red flag warning that could mean the market is in for a sizable correction.
On the Nasdaq 100 (NDX or QQQQ), the rising wedge uptrend since the February low was finally broken on Friday:

This breakdown from the rising wedge, along with the weekly bearish engulfing candlestick, VIX breakout over 20, and the excessive bullishness of newsletter writers, increases the likelihood that the market is in for more selling. A number of other indicators point to more selling to come, though there's a possibility of a short-term bounce first after Friday's sharp sell-off. Any market bounce should be used to sell non-mining stocks.
While the stock market looks like it's in for some more selling, the gold and silver markets look very strong. We've advocated accumulating gold, silver, and quality mining stocks on pullbacks, and that strategy has worked quite well:
Considering the longer-term trend higher in gold in its powerful bull market, this pullback should prove to be a great buying opportunity for longer term, for gold and silver as well as quality mining stocks.

After the strong rally in stocks over the past year+, this looks like a particularly good time to reallocate portfolio assets from non-mining stocks into gold and silver. While stocks look like they could be in for more selling, gold is breaking out to new highs on the year, and is very close to breaking out to new all-time highs.
Holding a portfolio allocation of long gold and short the Nasdaq 100 from early 2000 for 9 years would have made over 10 times your money, with similar results for silver:

Shifting portfolio allocation from gold and silver to the Nasdaq 100 and back based on stochastics signals (bottom pane) would have yielded even much better results, particularly when combined with the 36-month EMA and Bollinger Bands. Moving from gold to the Nasdaq 100 when this ratio was well above its upper Bollinger Band and the faster black stochastics line crossed below the slower red stochastics line above the 80 level, and then moving from the Nasdaq 100 back to gold when this ratio came back to meet the 36-month EMA while the stochastics lines were below the 20 level would have yielded tremendous returns with very little drawdown, and particularly strong outperformance during market corrections.
Right now, this portfolio re-allocation strategy indicates a shift to long gold and short the Nasdaq 100 should be made. This ratio is just coming off the 36-month EMA, and the stochastics lines are oversold below 20, and look like they should cross back up soon. Quality gold and silver mining stocks are also recovering from their financial crisis lows, and those that are well-financed with large deposits are poised to move up much faster than gold and silver because of their leverage. Mining juniors that have survived the financial crisis while maintaining large deposits and improving or maintaining healthy cash positions may perform the best of all because of their extreme leverage.
Silver has been more volatile than gold in recent years, but remains severely undervalued relative to gold on a historical basis. Currently, the gold/silver ratio is around 63.5, but the historical average over the centuries has been around 16. That means that if silver returns to its historical ratio with gold, it should quadruple relative to gold, even if gold is headed to much higher levels. This article discusses some reasons silver should move much higher relative to gold. For long-term investors, silver and silver mining stocks, particularly quality juniors with large deposits, could have exponential returns if the precious metals bull market continues.
As for fundamentals, the sovereign debt crisis around the world is starting to evidence itself with the crisis in Greece and the downgrades of Spain and Portuguese debt. As sovereign debt issues decrease the value of paper currencies around the world, the value of the hard currencies, gold and silver (the word for money in many languages is the same as the word for silver), will increase significantly.
This article describes the fundamental issues pointing to much higher gold and silver prices
This NY Post article from April 11 described the gold and silver price manipulation to keep prices down.
Given the current technicals as well as the fundamentals, it looks like a strategic shift of portfolio allocation from stocks to gold and silver will likely pay off handsomely, especially if anything comes of any DOJ investigation into silver market manipulation. Aggressive traders can go short the Nasdaq 100 while going long gold and silver to fully participate in this ratio strategy. Even if the stock market continues higher unabated, the likely faster increase in gold and silver should reward investors who make this shift. If stocks should finally experience a significant pullback while gold and silver break out, this shift could be a life changer for some.
Archives
December 2005 January 2006 February 2006 March 2006 April 2006 May 2006 July 2006 August 2006 October 2006 November 2006 December 2006 January 2007 February 2007 March 2007 April 2007 May 2007 June 2007 August 2007 October 2007 November 2007 May 2008 September 2008 October 2008 January 2009 February 2009 March 2009 April 2009 May 2009 June 2009 July 2009 August 2009 September 2009 October 2009 November 2009 December 2009 March 2010 May 2010 June 2010
Great Trades Home Email GreatTrades
Great Investments Blog Great Investment Articles BlogDisclaimer: Great Trades may have a position in all or some of the stocks discussed in this blog, but is not paid by any company to promote their stock. Great Trades contains opinions, none of which constitute a recommendation that any particular security, transaction, or investment strategy is suitable for any specific person. Great Trades does not provide personalized investment advice.

![]()