Great Trades
Great stock trades based on fundamentals and technical analysis.Saturday, December 10, 2005
MVCO Cup & Handle Breakout
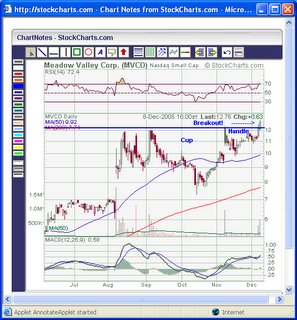
MVCO had a clear breakout from its Cup & Handle pattern on Thursday. Below is an illustration of this chart:

The depth of the right side of the cup is a little over 5 points. That means the target of this pattern is around 17-17.50. We'll see if this pattern works over the coming weeks and months. The fundamentals as desribed below certainly support such a move.
From 11/8/05:
MVCO's blowout report justifies a much higher price. They reported .60 per share, a $20/share sales backlog, over $25 million cash, and have increased working capital from $1.8 million a year ago to over $20 million now. Based on the fundamentals, this stock should be well over $20. With the average PE for the industry around 27, and some much higher (http://finance.yahoo.com/q/in?s=MVCO), you could argue MVCO should be worth 27 times annualized $2.40 EPS, or over $64 a share. Even if you assume future quarters will only be half as good as this quarter, that would still be $1.50 in earnings for the year, which should justify a $40.50 price with a 27 PE. As a turnaround story, it could take a couple more quarters of great results for MVCO to completely earn investors' confidence and get to a more appropriate valuation, but the turnaround started with last quarter's great report, making this 2 stellar reports indicating a strong turnaround.
If Toll Brothers hadn't warned this morning, sending everything related to housing and construction down big, MVCO would have done much better. It probably would have held the early $12 level, and then run further on the technical breakout. As it is, it didn't hold that level after the Toll Brothers warning, so daytraders and short-term traders exited, sending it down below $11. While the fundamentals point much higher, the technicals pointed to a selloff.
MVCO's earnings reaction today was much like GOOG's reaction to past earnings reports. Several times, GOOG announced stellar earnings, only to sell down from the gap as short-term traders exited. It then moved up strongly after that as the fundamentals took over. If you had bought GOOG at the high the day after earnings in April, you'd have felt pretty bad by the end of the day when you were down over $8. However, if you waited until today to sell, you'd have been up over $170.
In the long run, the fundamentals win out. I think MVCO will be much higher in coming months. The weekly chart looks poised for a great breakout, and the Point & Figure chart shows a target of $21.50:
http://stockcharts.com/def/servlet/SC.pnf?chart=mvco,PLTADANRBO[PA][D][F1!3!!!2!20]&pref=G
Now, if the real estate market or the stock market crash in coming months, that could put a damper on the MVCO story. MVCO is in the construction industry, with 2 business segments -- construction services and construction materials (through their Ready Mix concrete subsidiary). To me, MVCO represents a great risk/reward investment in the $10-12 area, but as always, plese remember to be careful...
Archives
December 2005 January 2006 February 2006 March 2006 April 2006 May 2006 July 2006 August 2006 October 2006 November 2006 December 2006 January 2007 February 2007 March 2007 April 2007 May 2007 June 2007 August 2007 October 2007 November 2007 May 2008 September 2008 October 2008 January 2009 February 2009 March 2009 April 2009 May 2009 June 2009 July 2009 August 2009 September 2009 October 2009 November 2009 December 2009 March 2010 May 2010 June 2010
Great Trades Home Email GreatTrades
Great Investments Blog Great Investment Articles BlogDisclaimer: Great Trades may have a position in all or some of the stocks discussed in this blog, but is not paid by any company to promote their stock. Great Trades contains opinions, none of which constitute a recommendation that any particular security, transaction, or investment strategy is suitable for any specific person. Great Trades does not provide personalized investment advice.
