Great Trades
Great stock trades based on fundamentals and technical analysis.Sunday, May 09, 2010
Portfolio Re-allocation Update: Sell Stocks, Buy Gold and Silver
After the strong rally in stocks over the past year+, this looks like a particularly good time to reallocate portfolio assets from non-mining stocks into gold and silver. While stocks look like they could be in for more selling, gold is breaking out to new highs on the year, and is very close to breaking out to new all-time highs.
Right now, this portfolio re-allocation strategy indicates a shift to long gold and short the Nasdaq 100 should be made.
This breakdown from the rising wedge, along with the weekly bearish engulfing candlestick, VIX breakout over 20, and the excessive bullishness of newsletter writers, increases the likelihood that the market is in for more selling. A number of other indicators point to more selling to come, though there's a possibility of a short-term bounce first after Friday's sharp sell-off. Any market bounce or gold/silver pullback should be used to sell non-mining stocks.
We got the short-term bounce on Monday, which was the perfect opportunity to sell out and reverse to short on the Nasdaq 100. Then, there was a small pullback in gold on Tuesday into Wednesday, which was a great opportunity to add more gold, and a larger pullback in silver and mining stocks into Wednesday, which was a great opportunity to add more of both (we pointed that out in our Wednesday morning blog update.
After Monday, the Nasdaq, along with the rest of the stock market, was hit very hard, with its worst week since the March 2009 lows, highlighted by the intraday collapse during Thursday's historic selloff:

Meanwhile, gold has broken out to a new all-time closing high on the weekly chart:

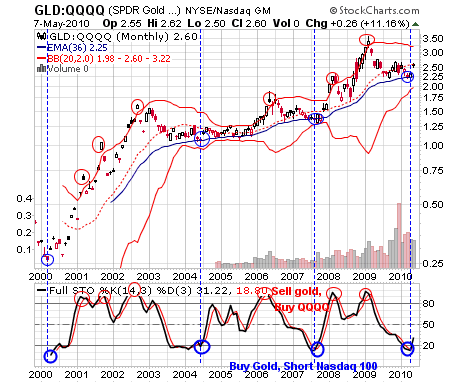
The result has been a clear and powerful breakout on the GLD/QQQQ chart:

The monthly chart of this ratio now shows a clear buy signal:
Back in March 2009, near the beginning of this rally, we highlighted the importance of 9-to-1 up days in identifying bear market bottoms:
This award-winning paper, Identifying Bear Market Bottoms and New Bull Markets, discusses the fact that major market bottoms are identified by a series of 90% downside days followed by 90% upside days. This is exactly what we've had in recent weeks, and it looks like today we had a 3rd 90% upside day of this rally.
Now, coming off the recent peak, there has been a cluster of 9-to-1 down days:

The last time we saw such a cluster of 9-to-1 down days coinciding with the breakout of the VIX from a base in the 20 area was in September 2008, which was the start of the precipitous decline that ended in the March 2009 bottom. That doesn't mean that the same type of decline will happen again here, but it's certainly a possibility for which investors should be prepared.
There are some other indicators pointing to the likelihood of more selling to come.
The weekly chart of the S&P 500 now shows a bearish cross on PPO:

On the daily S&P 500 chart, the 13 and 34-day exponential moving averages have crossed back down (blue line crossing below red line):

These bearish cross signals are negatives for the stock market, but, as happened at the February bottom this year and July bottom last year (we pointed out the bullish 13/34 cross in our July 20 update ), they can be overcome with a strong rally back.
After this week's strong selloff, the market is at extremely oversold levels on a short-term basis.
Over the last 10 years, the NYMO (NYSE McLellan Oscillator) has dipped below -100 only 7 times, and only once below the current level (October 2008):

Each time the NYMO has reached these oversold readings, the S&P 500 has bounced for at least a day or two, starting immediately or within a couple of days. However, with the exception of November 2009, every one of these bounces has been met with selling to lower levels. Also, every one of these readings came with the NYSI at a lower level (NYMO is the rate of change of the NYSI), so there's now a lot more room for negative NYMO readings to come.
After the break of 20 resistance the previous week coincided with the beginning of the selling, the VIX has now more than doubled from that point, closing well above its upper Bollinger Band on Friday:

Given the current state of our technical indicators, we don't believe the selling is over for the stock market yet, and there could be much more to come. However, given the extremely oversold conditions in the short term, we could see a market bounce any time now.
With gold breaking out to new highs (weekly chart in U.S. dollars, all charts in other currencies) and the Gold/QQQQ ratio on a long-term buy signal, we continue to believe investors should use market bounces as an opportunity to shift portfolio allocation away from non-mining stocks toward gold and silver as well as mining stocks (those with large amounts of gold or silver), with aggressive investors also shorting the U.S. Stock market. Most people are only now seeing that fiat currencies are in a race to devalue in order to service their debt, resulting in the inevitable increase in the relative value of the hard currencies, gold and silver, which have over many centuries been the real store of value.

Archives
December 2005 January 2006 February 2006 March 2006 April 2006 May 2006 July 2006 August 2006 October 2006 November 2006 December 2006 January 2007 February 2007 March 2007 April 2007 May 2007 June 2007 August 2007 October 2007 November 2007 May 2008 September 2008 October 2008 January 2009 February 2009 March 2009 April 2009 May 2009 June 2009 July 2009 August 2009 September 2009 October 2009 November 2009 December 2009 March 2010 May 2010 June 2010
Great Trades Home Email GreatTrades
Great Investments Blog Great Investment Articles BlogDisclaimer: Great Trades may have a position in all or some of the stocks discussed in this blog, but is not paid by any company to promote their stock. Great Trades contains opinions, none of which constitute a recommendation that any particular security, transaction, or investment strategy is suitable for any specific person. Great Trades does not provide personalized investment advice.

![]()